

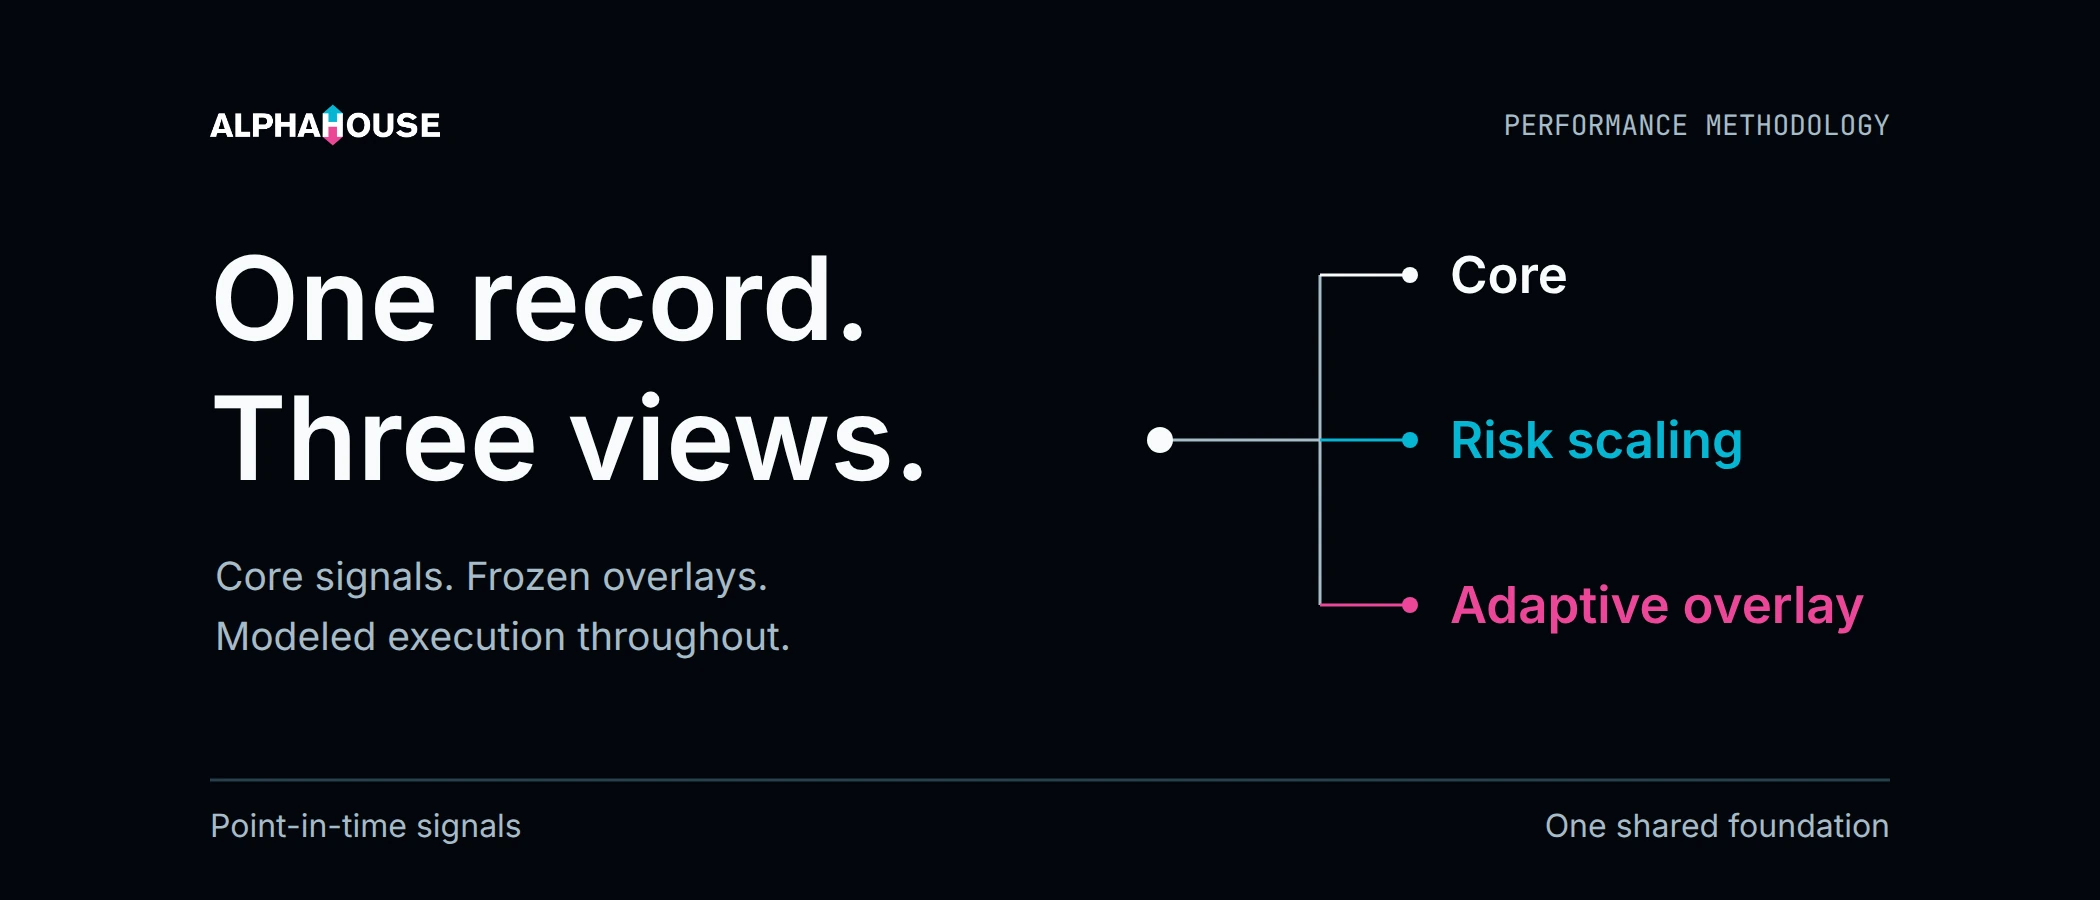
Every curve on the AlphaHouse performance page starts with the same core signal history: rankings generated by our system and recorded at the time, before the market outcomes they describe.
The chart calculates returns from those signals with modeled execution, including fees, slippage and funding. It shows the strategy's modeled performance, rather than the returns of a particular trading account.
One core strategy, two overlays
The page shows three versions of the strategy:
- Core Strategy: The base strategy built from our recorded rankings.
- Core + Regime De-risking: The core strategy with an additional risk-scaling overlay.
- Core + Regime-Adaptive Signal: The core strategy with an additional adaptive overlay.
The overlays are variations on the same underlying strategy. They add rules for adapting how it is run and sized; they do not replace the historical core signals with newly generated ones.
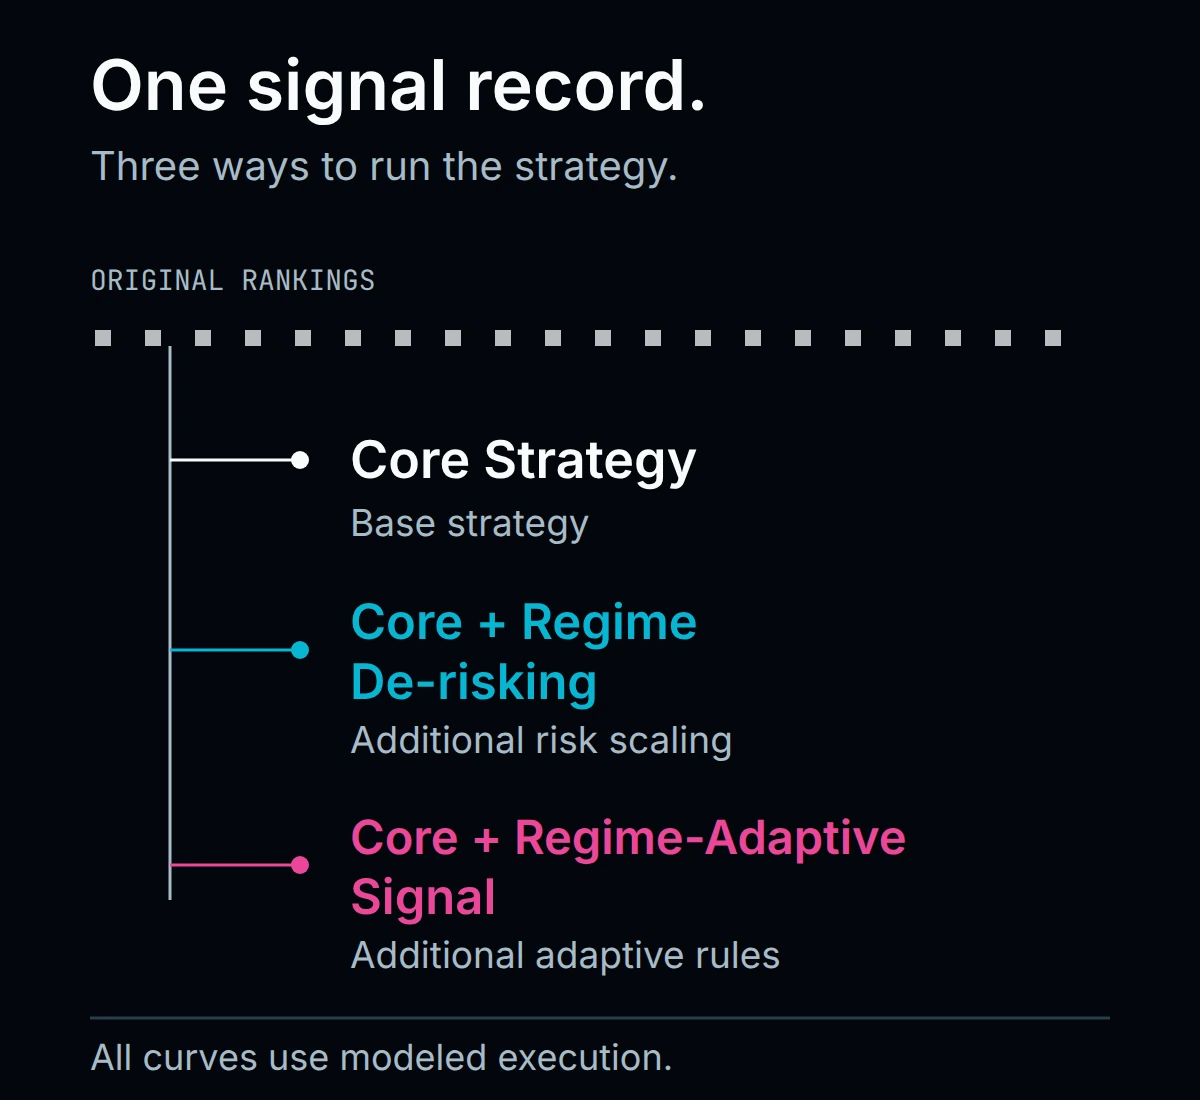
The same recorded rankings underpin all three versions. Each curve includes modeled execution costs.
December 2025: we began trading with real money
We began trading the strategy with real capital on December 1, 2025. That was a milestone for us as an organization. It did not change the core model or turn the chart into a record of actual account returns.
The public curves use the same modeled approach before and after that date. An account's actual results depend on its fills, costs and available contracts.
July 2026: both overlays were frozen
We finalized and froze both overlays on July 1, 2026. Their rules have remained unchanged since then.
Results after the freeze are out-of-sample for those overlays: they use new market data that arrived after the rules were fixed.
Before July 1, the underlying core signals are still the original point-in-time signals. The overlay curves apply the later-developed rules to that history. Because the history was available during development, those earlier results are historical evaluations of the overlays, rather than out-of-sample tests of them.
That is the distinction to keep in mind: the signal record was generated as events unfolded; the overlay rules were finalized later.
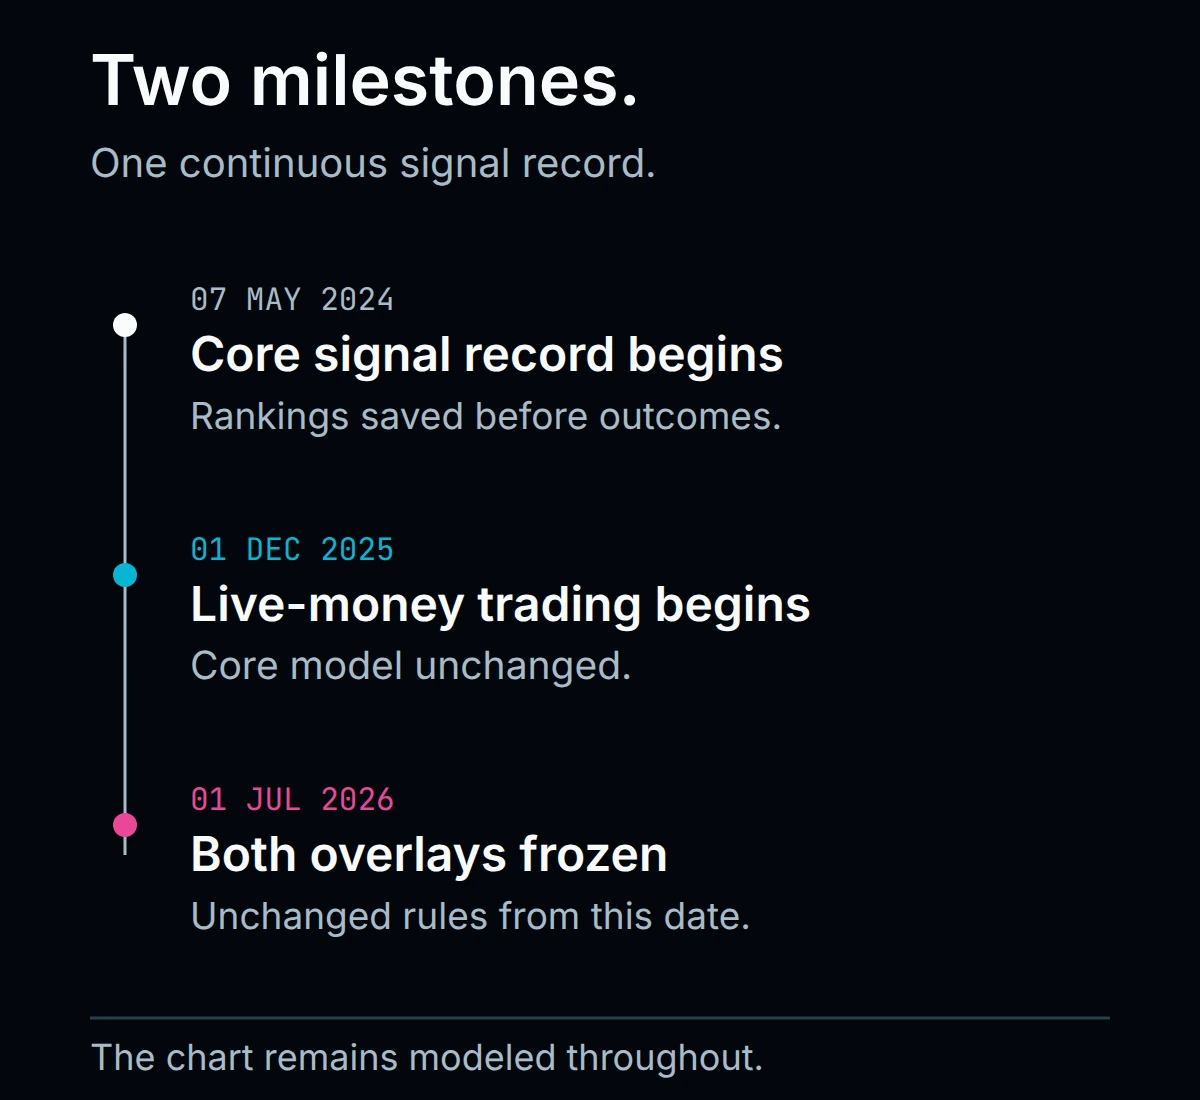
Live capital began in December. Both overlays were frozen in July. The chart remains modeled throughout.
How to compare the curves
Compare the three versions over the same dates to see how the overlays changed the modeled outcome. Use the Since frozen view to examine their performance after the rules were fixed, and look at losing periods alongside winning ones.
The performance page carries the current figures and calculation notes. All three curves include modeled trading costs. They are not a promise of the fills, returns or maximum loss in your account.