

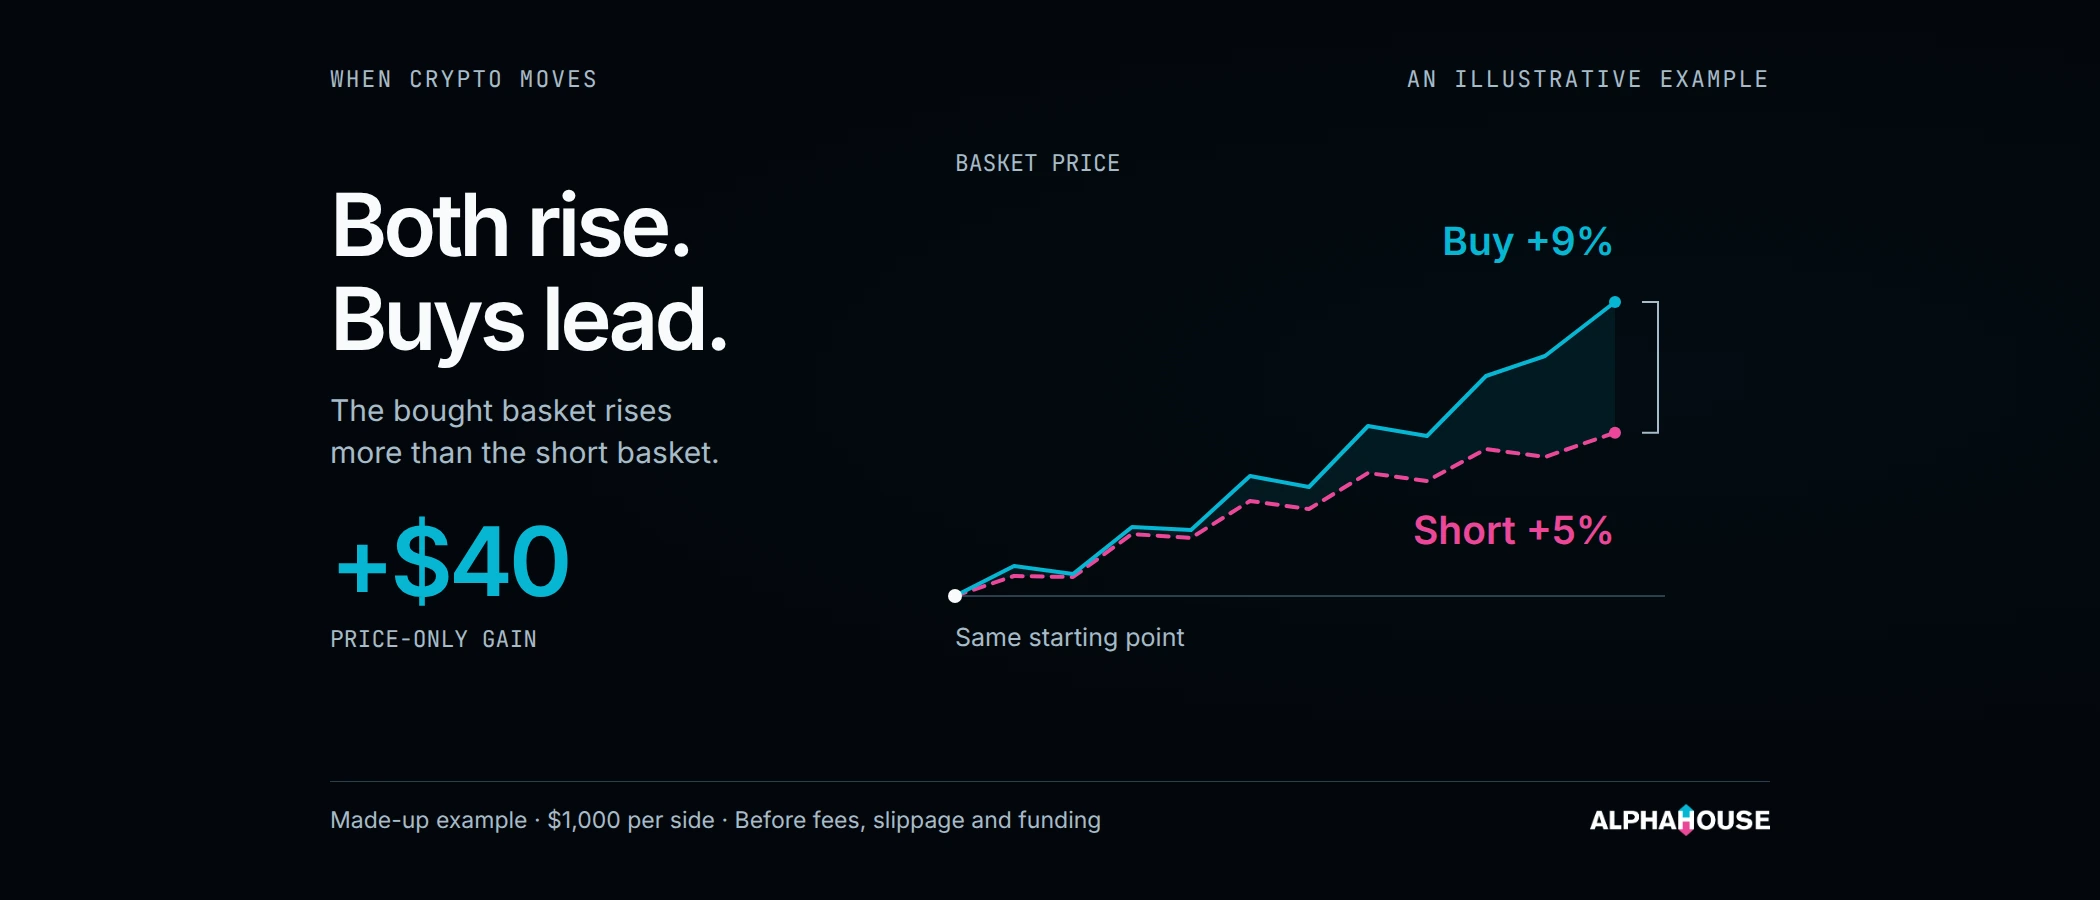
You can make money with a long/short trade when crypto falls. You can also lose money when crypto rises. What counts is whether the coins you buy do better than the coins you short.
On our homepage, we explain the trade: buy top-ranked crypto perpetual futures and short bottom-ranked ones. A perpetual future is a contract that tracks a coin’s price without an expiry date. The strategy aims to start with the same dollar amount on each side, then rebalance every weekday. That cuts down the need to bet on the whole market’s next move. It does not make the trade safe.
Follow the two sides
Say we buy $1,000 of one basket and short $1,000 of another. When a coin we short rises, we lose on that side; when it falls, we gain. These three cases show price moves only over an example holding period. They are made-up examples, not our trades or returns.
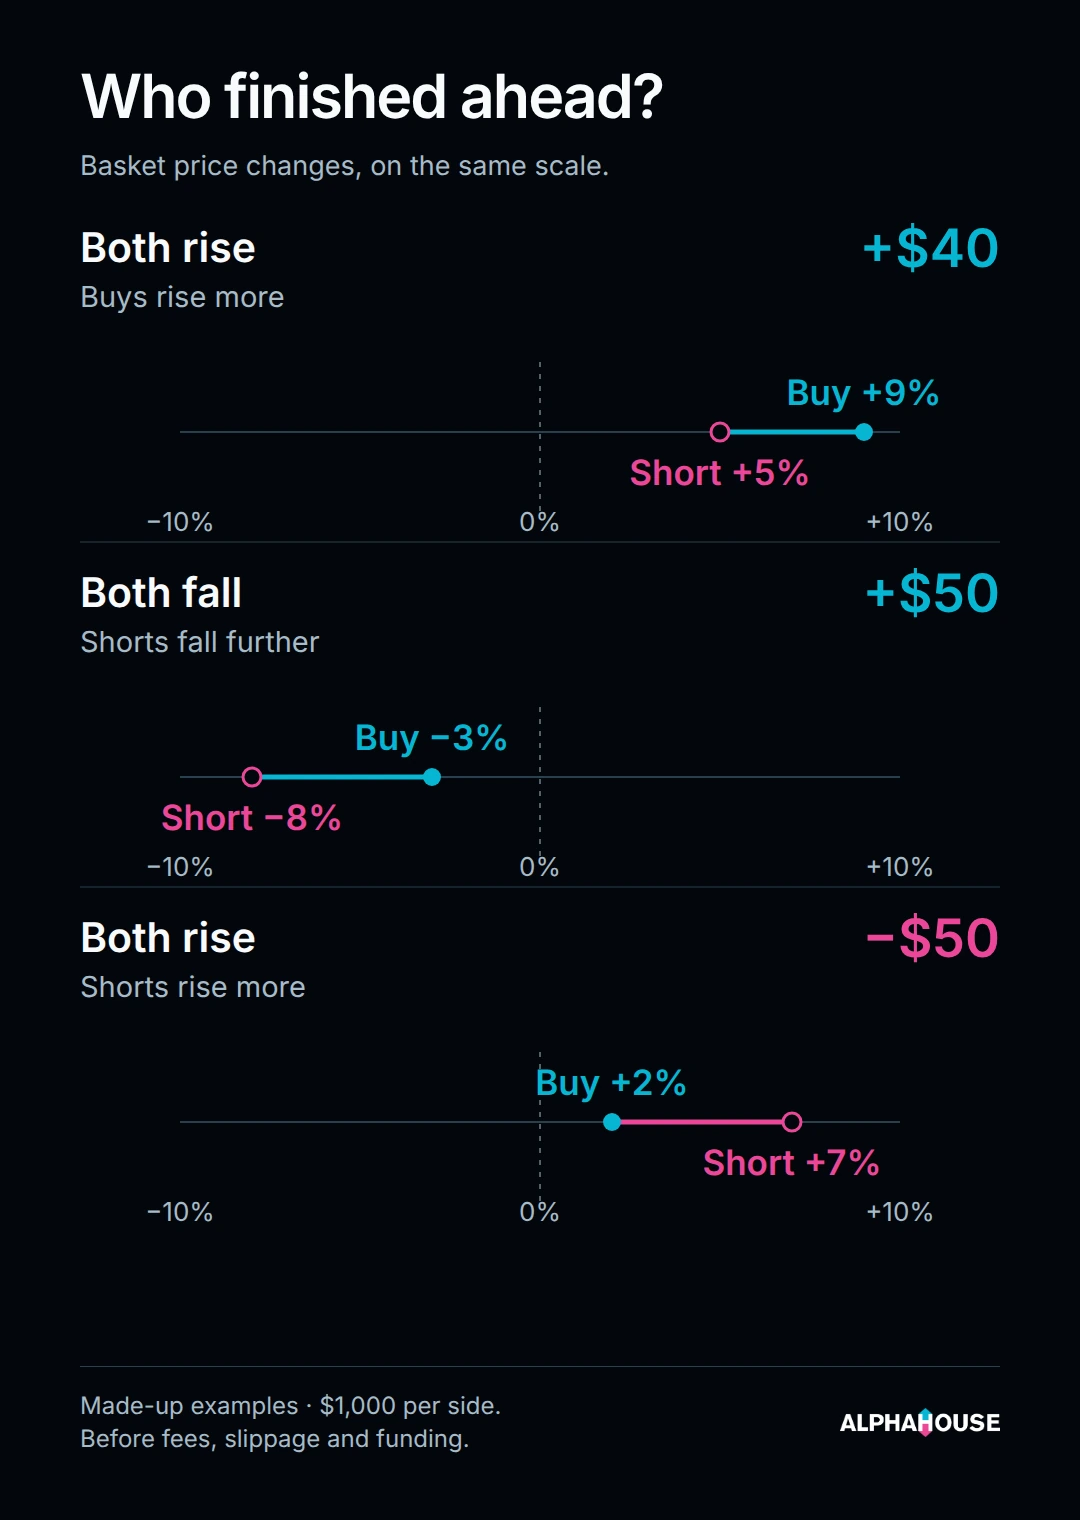
What matters is which basket does better. On this shared scale, Buy to the right of Short means a price gain; Buy to the left means a price loss. Each example starts with $1,000 on each side and excludes costs.
With equal starting dollars, subtract the short basket’s price change from the long basket’s. In the first example, 9% minus 5% leaves 4% of $1,000, or $40. In the last example, we picked the wrong side of the race and lost $50 even though crypto went up. The ranking has to earn its keep.
These examples leave out the cost of trading and holding the contracts. Fees are what the exchange charges to trade. Slippage is the gap between the price we aim for and the price we get. Funding is a payment between people holding long and short perpetuals; it can cost us or help us. If those costs total $10 in the first example, the $40 price gain becomes $30 before any other charges. That $10 is made up, too; actual costs may be higher or lower.
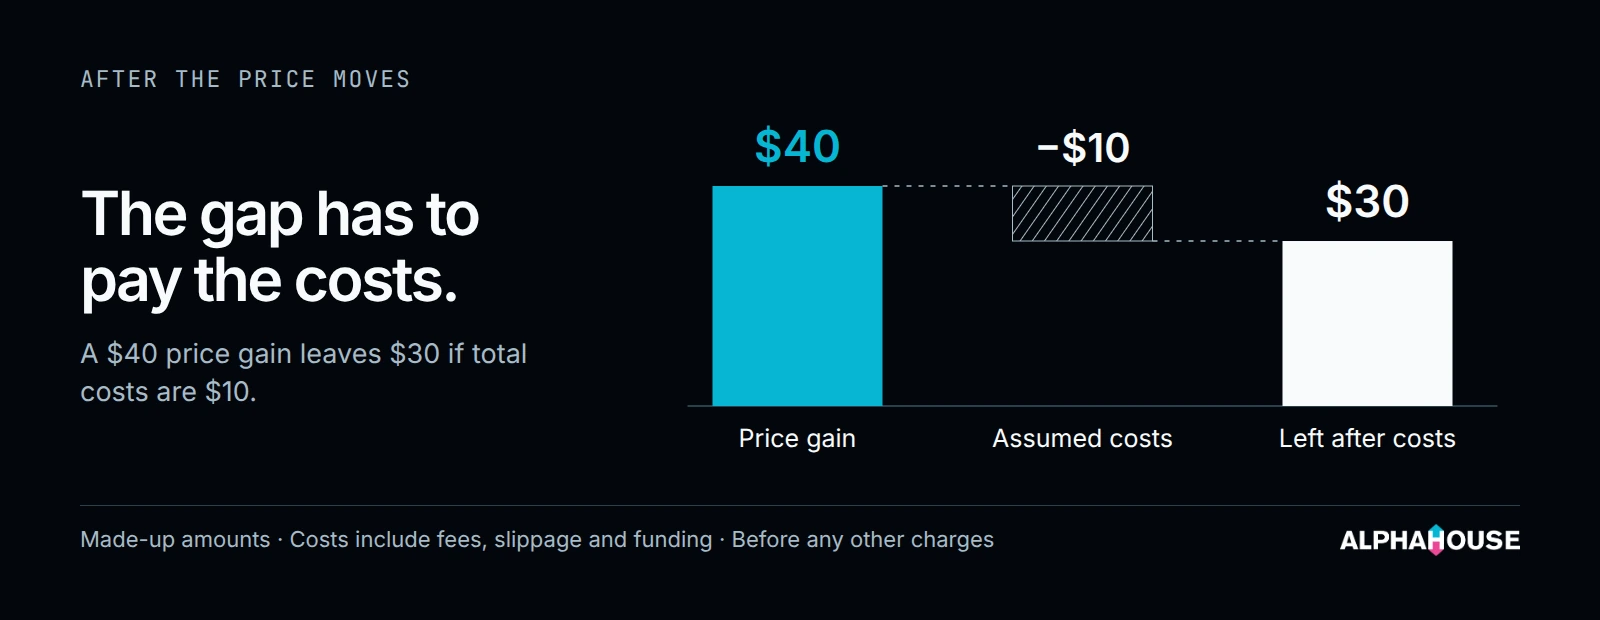
A price gain is only the starting point. Here, assumed total costs reduce $40 to $30 before any other charges.
Equal dollars still leave risk
Buying and shorting the same dollar amount can soften a broad market move, but the coins on each side may move by different amounts. A short can jump while the coins we bought lag. The dollar balance also changes as prices move between rebalances.
Our homepage’s product sheet describes the ranking, limits on each coin’s size and risk-based changes to the whole book’s size. That gives you a repeatable process instead of rebuilding both sides yourself each weekday. It cannot make a bad pick good. Perpetual futures use leverage, and a sharp move can lead to large losses or liquidation, when the exchange closes a position because there is not enough margin.
When execution leaves the book incomplete
An outage, rejected order or partial fill can leave your account holding a different mix from the intended portfolio. If buys fill while corresponding shorts do not, for example, the account can have more directional exposure than intended. Check the positions and open orders at your exchange; an intended position is not confirmation of a fill. The daily rebalance guide explains how targets become orders.
What sizing controls cannot do
These controls do not set a maximum loss. AlphaHouse rebalances once a day on weekdays and does not use conventional intraday stop-losses. Prices can move sharply between runs, before the next sizing decision takes effect. Reducing the book's size reduces exposure when the orders execute; it cannot undo losses already incurred. The daily rebalance guide explains the schedule and its limits.
Put a good month beside a bad one
In our published modeled Core + Regime De-risking series, August 2026 returned +11.4% and February 2026 returned −6.6%. These are calendar-month results from the same model, not the $1,000 examples above and not returns from your account. The performance record covered 7 May 2024 through 5 October 2026 when checked for this article.
The public record says its daily rankings were saved at the time, before that day’s trades. The curve uses those records to model trades, including fees, slippage and funding. That makes it more useful than a price-only chart, but an account’s fills and available contracts can differ. The performance page says real capital was committed on 1 December 2025; the chart remains modeled throughout, so that date does not prove the model matched an account. Risk scaling was fitted using the earlier record, and the configuration was frozen on 1 July 2026. Keep that in mind when reading the earlier months.
To judge the trade, check whether the buys beat the shorts after costs, including in the losing months. See every month and how we model the costs before you put capital at risk.